Shadow play is an ancient form of storytelling and entertainment that uses flat figures (shadow puppets) that are held between light source and a translucent screen or screen.
Shadow Theatre has a long history and is popular in various cultures of Southeast Asia, China and Europe. The principle of shadow play evolved with the development of photography into the projection of slides and finally into cinematography. The common principle of these media is the creative use of light and the projection surface in conjunction with the creation of an image utilizing translucency.
On our didactic aid, you can try the principle of shadow play yourself. Observe at what distance objects of the same shape and different size need to be placed, so that their shadow is of the same size. You can also combine multiple shapes at different distances to create a complex panorama.
Observing shadows in nature can bring us interesting information. For example, the Greek scholar Aristotle experimentally derived the spherical shape of the Earth by observing the shadow of the Earth during a lunar eclipse. A similar principle as for shadow play – based on a linear function – allows foresters to measure the height of trees, or surveyors to determine the height of buildings only by measuring angles from accurate optical observations. You can learn more about this application in the Tales‘ Theorem exhibit.
A linear function is a function whose function value changes in simple proportion to the independent variable. A linear function on a set of real numbers is any function f that is given by the formula:
ƒ : y = ax + b
where a, b∈R. The domain is all real numbers Dy = R.
Graph of a linear function is a straight line. The important points of the graph of linear function are the intersections of the line with the x and y coordinate axes.
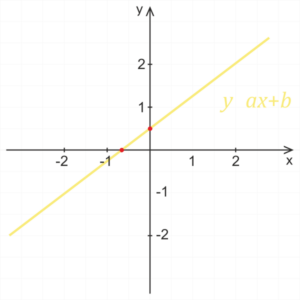
Influence of coefficients a, b on a graph of a linear function.
Influence of coefficient a
For a positive coefficient a the linear function is increasing, for a negative coefficient a the function is decreasing. The larger the absolute value of the coefficient a, the more the graph incline closer to the y-axis. If the absolute value of the coefficient a is less than one, then as the absolute value of the coefficient a decreases, the graph of the function increasingly approach to the x-axis.
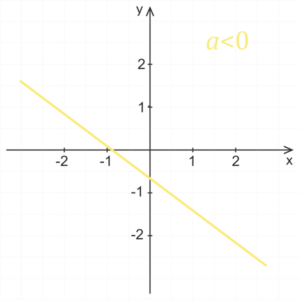
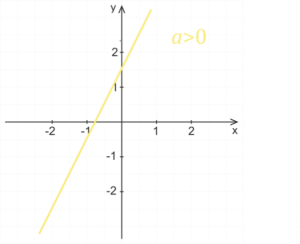
Influence of coefficient b
The graph of the function intersects the y-axis at a point with a ypsilon coordinate equal to the coefficient b.
a = 0
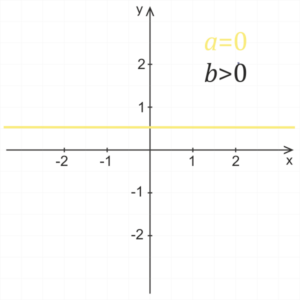
For the zero coefficient a we obtain formula y = b, which is the formula of the constant function.
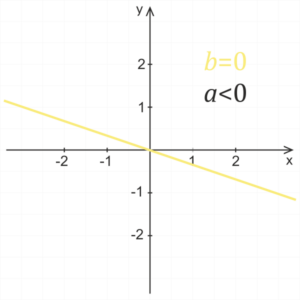
b = 0
For the zero coefficient b we obtain formula y = ax, which is the formula of a linear function whose graph passes through the origin of the coordinate system.
Calculation of the intersection of the graph of the linear function y = ax + b with the x-axis
Each point lying on the x-axis has a ypsilon coordinate equal to zero, after substituting y = 0 into the formula of the linear function we obtain a linear equation and by solving it we obtain the required intersection:
ax+b=0 x=-b/a;a≠0
Calculation of the intersection of the graph of the linear function y = ax + b with the y-axis
Each point lying on the y-axis has an ix coordinate equal to zero, after substituting x = 0 into the formula of the linear function we obtain the ypsilon coordinate of the required intersection:
y=0x+by= b


